Engula AutoBench (Benchmarking Tool)
1. Design Goals and Comparison Methodology
- Goal: Compare the Get/Set throughput and latency of Engula 2.1 versus Redis 7.2 across different value sizes and CPU core counts.
- Metrics: QPS (throughput), P50 (average latency).
- Comparison methodology:
- Single-machine comparison, with persistence disabled, focusing on in-memory path and protocol processing performance.
- I/O thread count dimension:
io-threads∈ {1, 2, 4}. - Data scale, request distribution, and concurrency model are fixed, so results are reproducible.
- Multiple value-size tiers are covered: 8B, 32B, 128B, 512B, 1KB, 2KB.
2. Product Introduction
2.1 Comparison Test Workflow
- Start the service (specifying
io-threadsand CPU affinity). - Run the formal benchmark (repeated 3 times and averaged).
- Record QPS and P50, and save the raw logs.
2.2 Test Data Cases
- Total keys: 1,000,000
- Value size tiers: 8B, 32B, 128B, 512B, 1KB, 2KB (tested tier by tier, with results produced for each).
2.3 Example Comparison Test Commands
In a test scenario where the server-side CPU resources are limited to 2 vCores and the value size is 128B, the test commands are as follows:
For other test scenarios, simply replace the CPU resource and value size parameters accordingly.
Quick Start Summary
| Item | Details |
|---|---|
| Tool overview | Automatically compares the performance of Engula and Redis across throughput, latency, CPU thread configuration, and value size dimensions. |
| Prerequisites | Docker can run on the local machine; at least 8 CPU cores recommended; prepare the output.log and summary.html output files. |
| Quick start | docker run --user $(id -u):$(id -g) -it --rm -v $(pwd)/output.log:/montplex/tmp_bin/output.log -v $(pwd)/summary.html:/montplex/tmp_bin/summary.html registry.ap-southeast-1.aliyuncs.com/montplex/engula-auto-bench:latest |
| Interpreting output | Focus on the QPS, P50, and CPU-dimension differences across different value sizes and I/O thread counts in summary.html. |
| Full example | See "Running Engula AutoBench" below. |
Command-Line Arguments
| Argument | Purpose |
|---|---|
--user $(id -u):$(id -g) |
Makes the log files generated by the container owned by the current user, making them easy to open and clean up directly. |
-v $(pwd)/output.log:/montplex/tmp_bin/output.log |
Mounts the terminal log output file. |
-v $(pwd)/summary.html:/montplex/tmp_bin/summary.html |
Mounts the HTML summary report output file. |
3. Usage Instructions
For ease of use, Engula AutoBench provides a Docker-based usage mode.
3.1 Runtime Environment
Engula AutoBench is provided as a Docker image and can run on Linux or macOS systems with Docker installed. The specific environment requirements are as follows:
- CentOS version ≥ 7.9
- Ubuntu version ≥ 18.04
- Using the official Docker release is recommended (installation guide; if your network access is slow, you can prepare the image in advance)
- A host with at least 8 CPU cores is recommended
- Glibc version ≥ 2.34 is recommended
3.2 Running Engula AutoBench
The execution result is shown below:
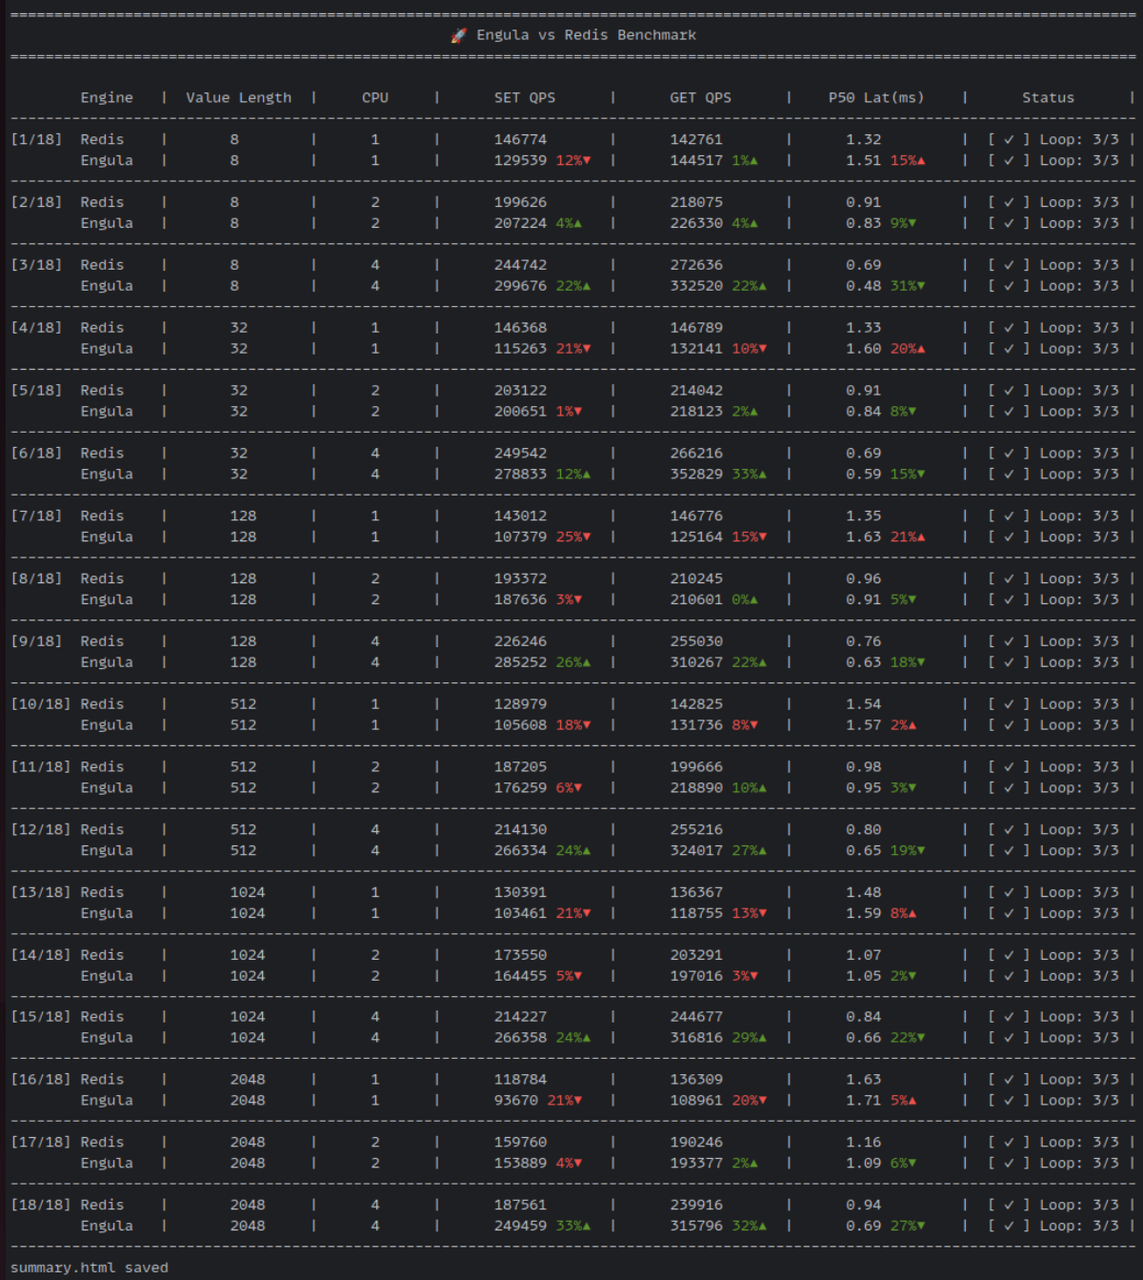
Since a total of 18 comparison groups are run, with Redis and Engula tested serially in each group and each group tested 3 times, the entire test takes approximately 40 minutes to complete.
3.3 Viewing the Results
After the run finishes, a summary.html file is generated. Open it in a browser to view the results, as shown below:
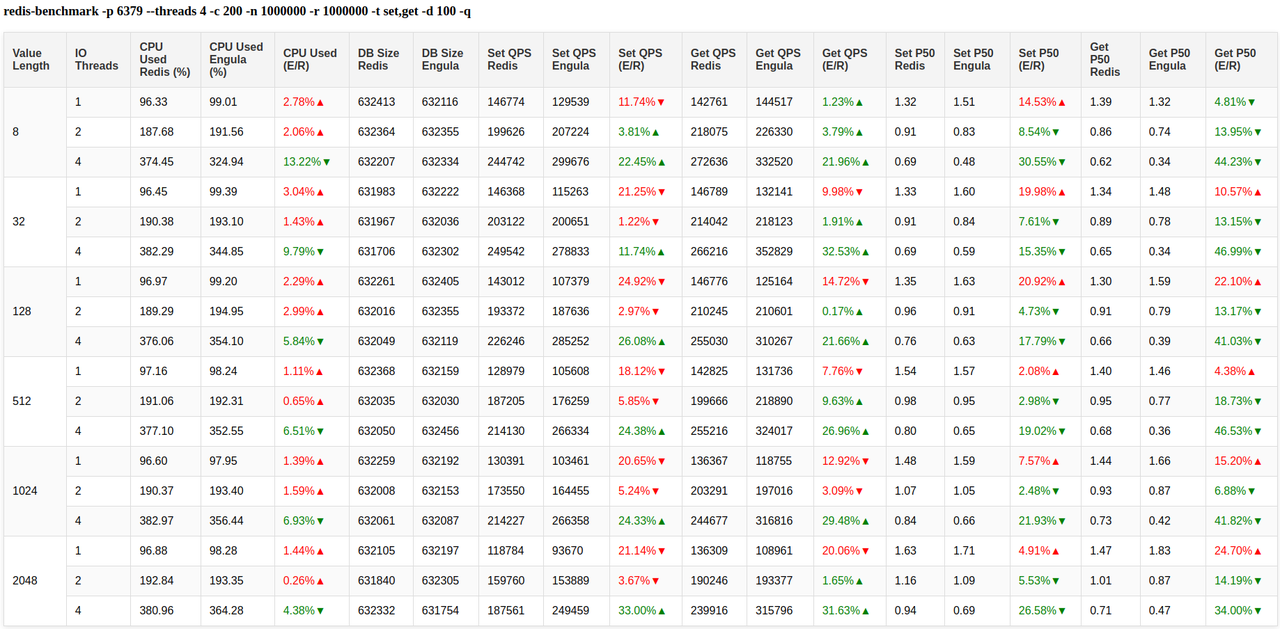
4. FAQ
4.1 My environment does not support Docker. Is there a binary-based testing method?
The official site recommends running via the Docker image. If your test machine cannot run Docker, please contact the Engula team to obtain an offline package matching your target operating system and CPU architecture; the offline package commands are documented in the README included in the delivery package.
4.2 Screen scrolling occurs when running the performance testing tool
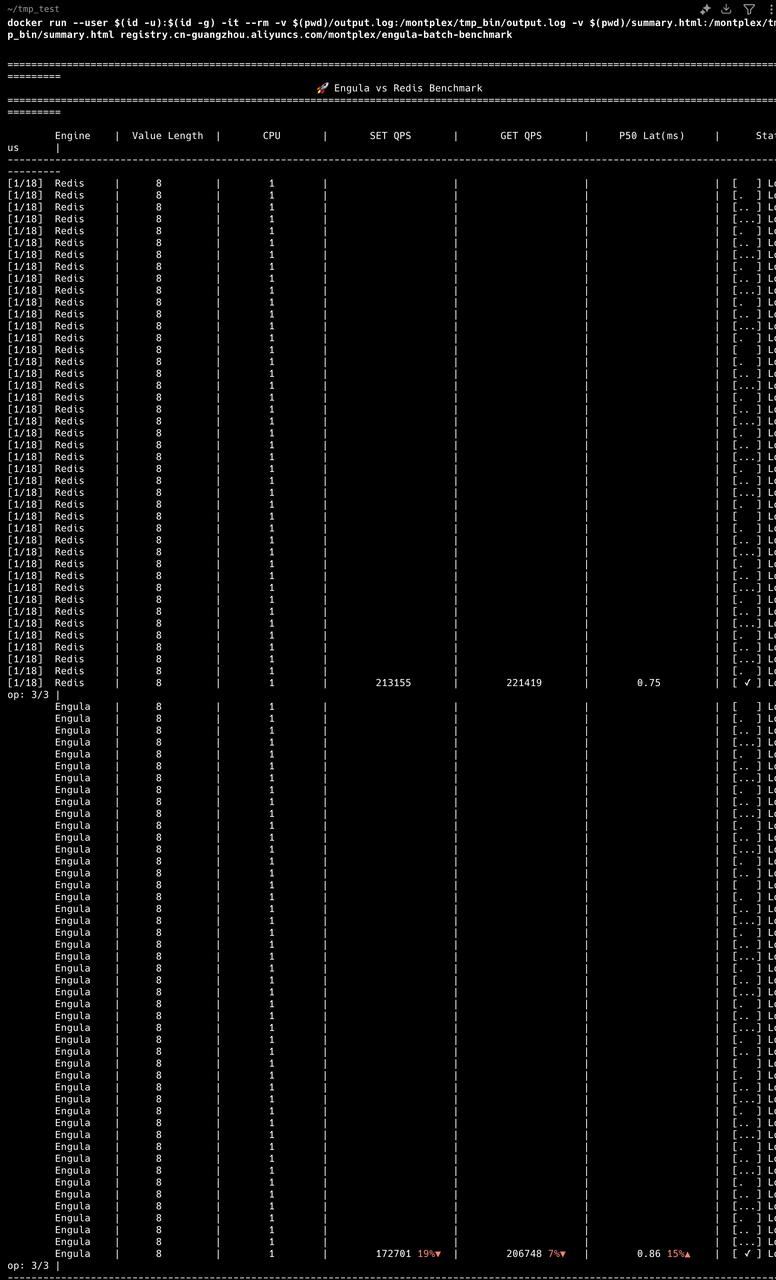
For example, the scrolling phenomenon shown in the image above may occur.
This happens because when the total width of the output content exceeds the terminal window width, the text wraps automatically. The carriage return character \r can only return to the beginning of the current line, but when content spans multiple lines, it cannot correctly overwrite the previous output, resulting in continuously generated new lines.
Solution: Reduce the terminal font size, or increase the terminal width.